
How To Create a Visual Tooltip in Power BI
Did you knew that you can use another page or a visual as a tooltip in Power BI?

Today’s lesson will be focused on using visuals or other pages as a tooltip when you hover over any specific visual. I focus on building a dashboard which are stupid simple! (K.I.S.S principle) and I try to avoid creating a lot of pages, unless necessary. People tend to underestimate the power of so many other alternatives before creating additional pages for the dashboard, with tooltip being one of them.
A quick sneak peek of what we will be building.
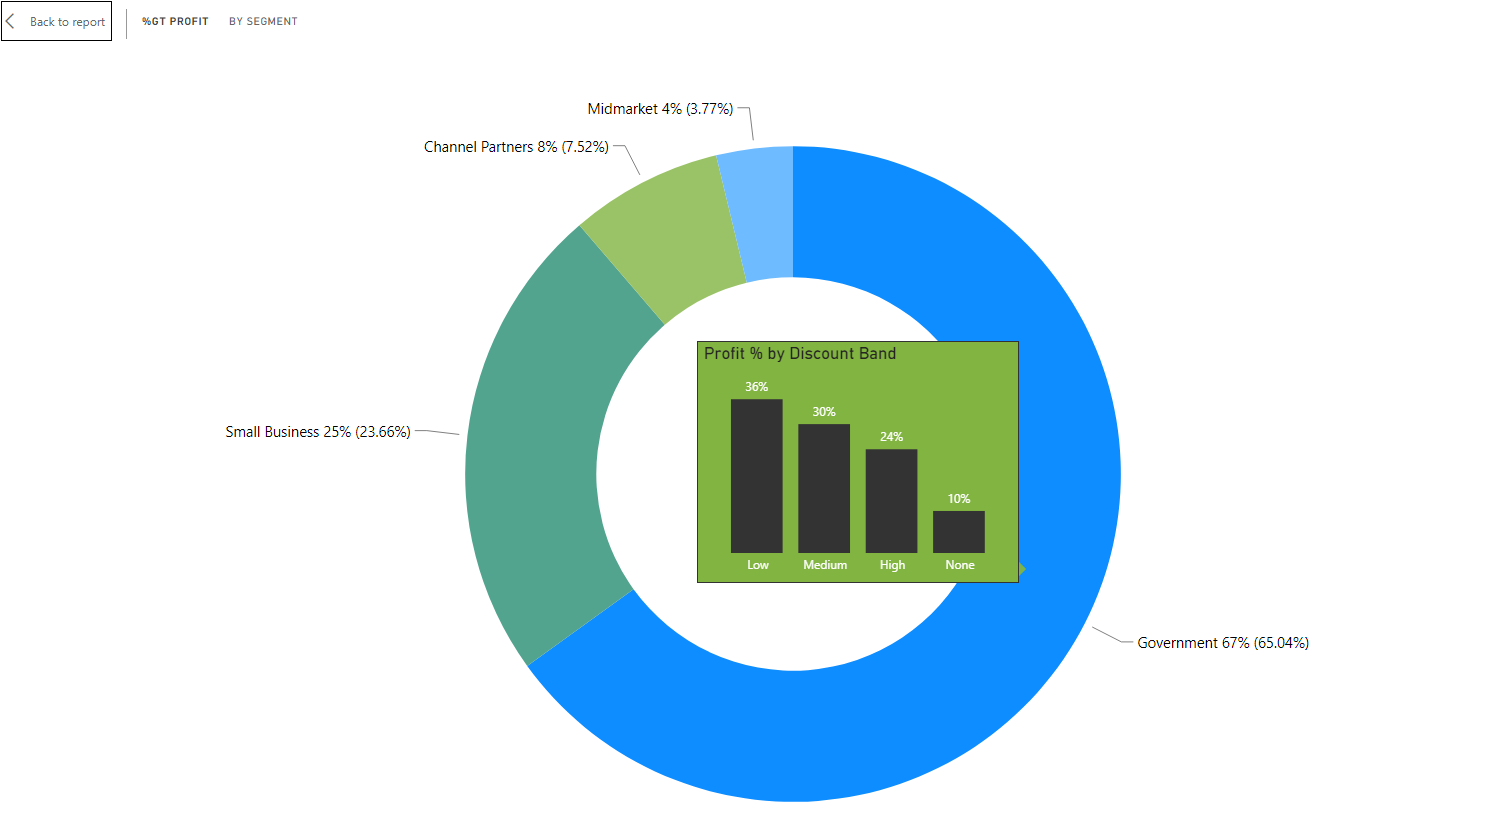
We will take as an example a dashboard we have created previously (you can download it here if you want to follow along). As you can see from the below, Profit % By Segment Chart is showing the participation of profits in percentage basis.

We got asked if we can include another chart where we can add also all the Discount Bands(Low, Medium, High, None). My first question is always ‘Is it a must to have chart?!’, if the answer is not YES, then I always try to find other alternatives that we can show the same information when needed instead of overloading the dashboards with visuals. A very useful method for this is a visual tooltip and that is what we did end up with this case.
This quick tutorial assumes that you have already built your main dashboard and now you are looking to build a visual tooltip.
1. Create a new page and rename it to ‘Tooltip’
2. Go to Format of the page and then select Page Information and define the page as Tooltip (switch toggle on, Step 1). After that, go to Page size and choose Tooltip from the dropdown (Step 2).

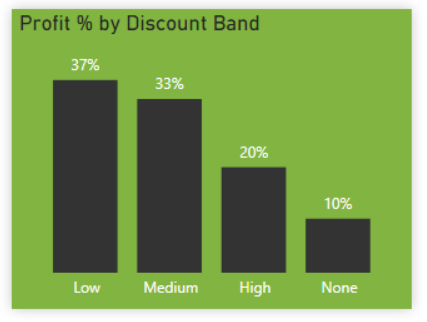
3. After you define your page as a tooltip, page size will get smaller, to the size of a tooltip. Go ahead and create the visual you want which will be used a visual tooltip
4. Now, go back to the which will use the chart above as visual tooltip. (please note this chart is dynamic in a sense that it will change for each segment). Select that visual and then go to Format, turn on if toggle is of for Tooltip. For Type if choose Report Page as will be using another page as tooltip. For Page choose the page name which will use as a tooltip (in our case Tooltip).

5. Now when you go back to the Dashboard page and hover over Profit % By Segment visual, Profit % by Discount Band will show as a visual tooltip.

When we were given the option to choose the Page Size for tooltip, we choose Tooltip size. Please note that there are other page sizes you can choose besides Tooltip size. Also you can use a custom size page and define it yourself. Another alternative might be building an entire page report and show that as a visual tooltip but it is not generally suggested as it will make your dashboard run slower.

That’s it for today. Do let me know any questions/suggestions you might have. Here is today’s file with the solution.
Cheers